Main problem
Information does not form an overall picture
Actions, audits, risks, training, objectives and claims emerge in different areas. The data exists, but relationships often remain hidden.

Dashboard & Reportings
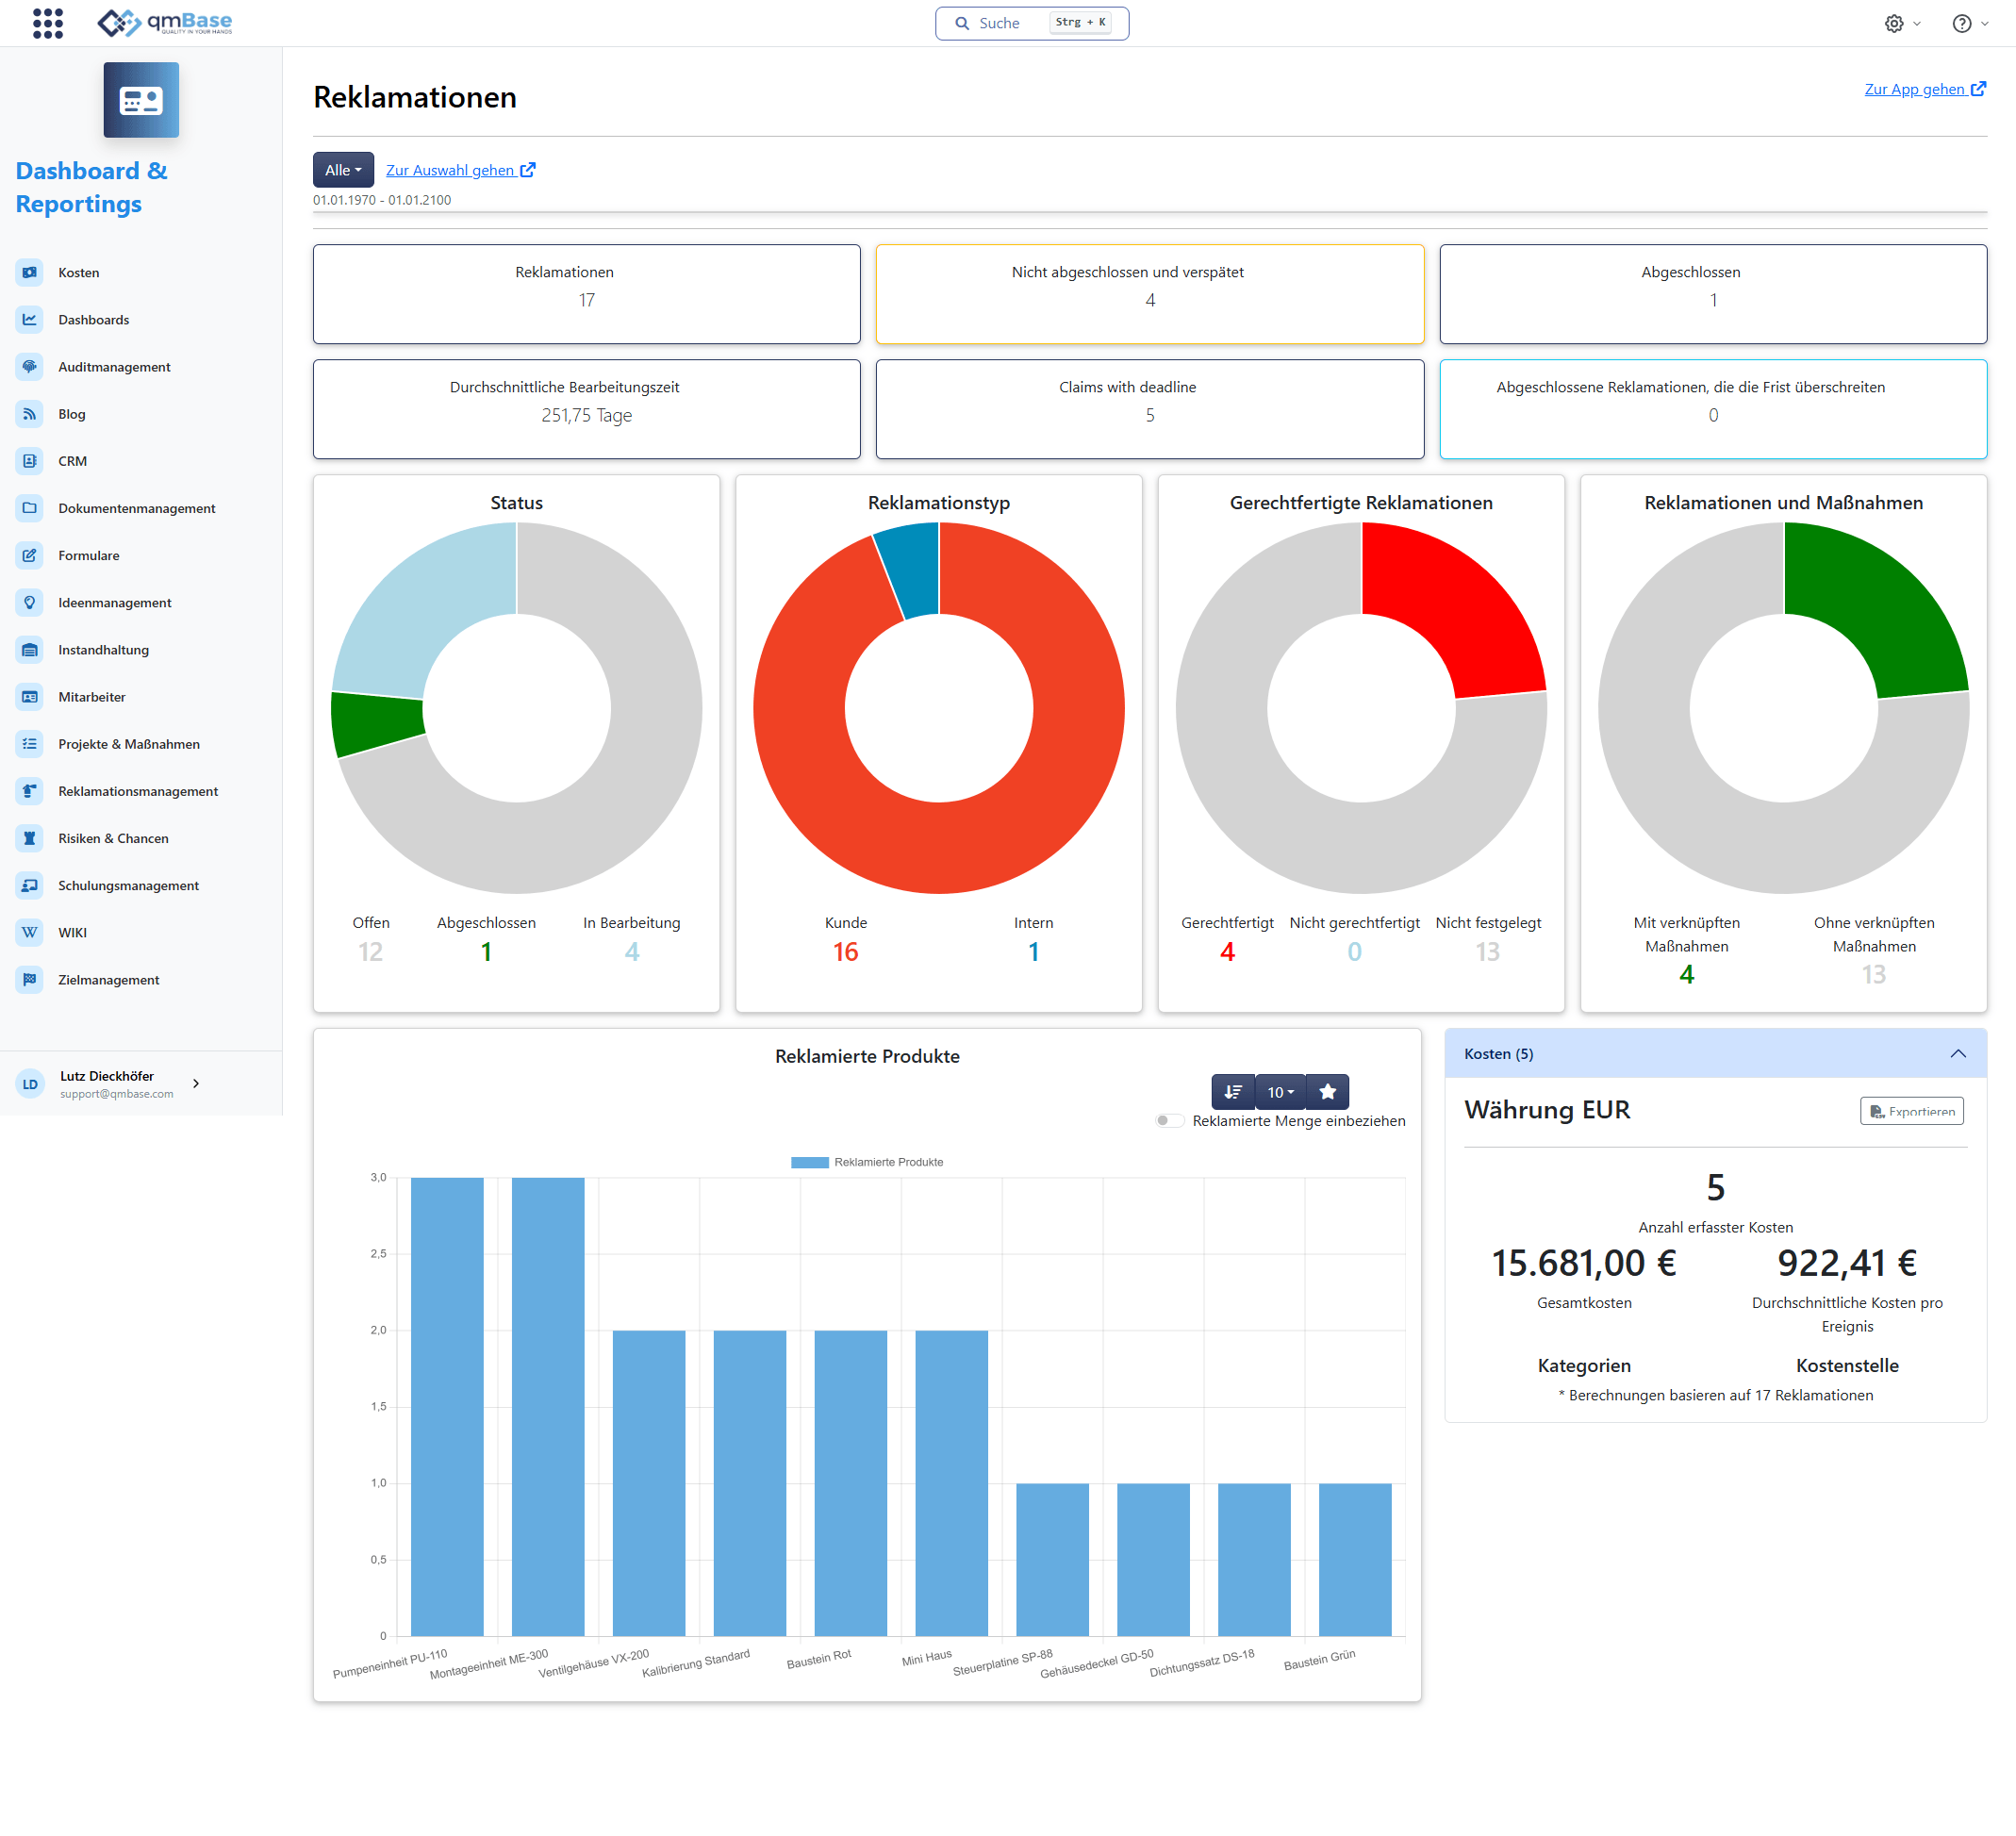
Dashboard & Reportings automatically aggregates information from your qmBase apps. Analyze claims, actions, risks, audits, training and other areas with meaningful metrics and trends.
The problem
A management system generates data every day. Without evaluation, it often remains isolated data points instead of reliable insights for decision-making, reviews and continuous improvement.
Typical questions
Main problem
Actions, audits, risks, training, objectives and claims emerge in different areas. The data exists, but relationships often remain hidden.
Consequence 1
Individual information is documented. Critical trends, clusters and anomalies are often recognized too late.
Consequence 2
Without meaningful metrics, the basis for management reviews, prioritization and improvement actions is missing.
How Dashboard & Reportings helps
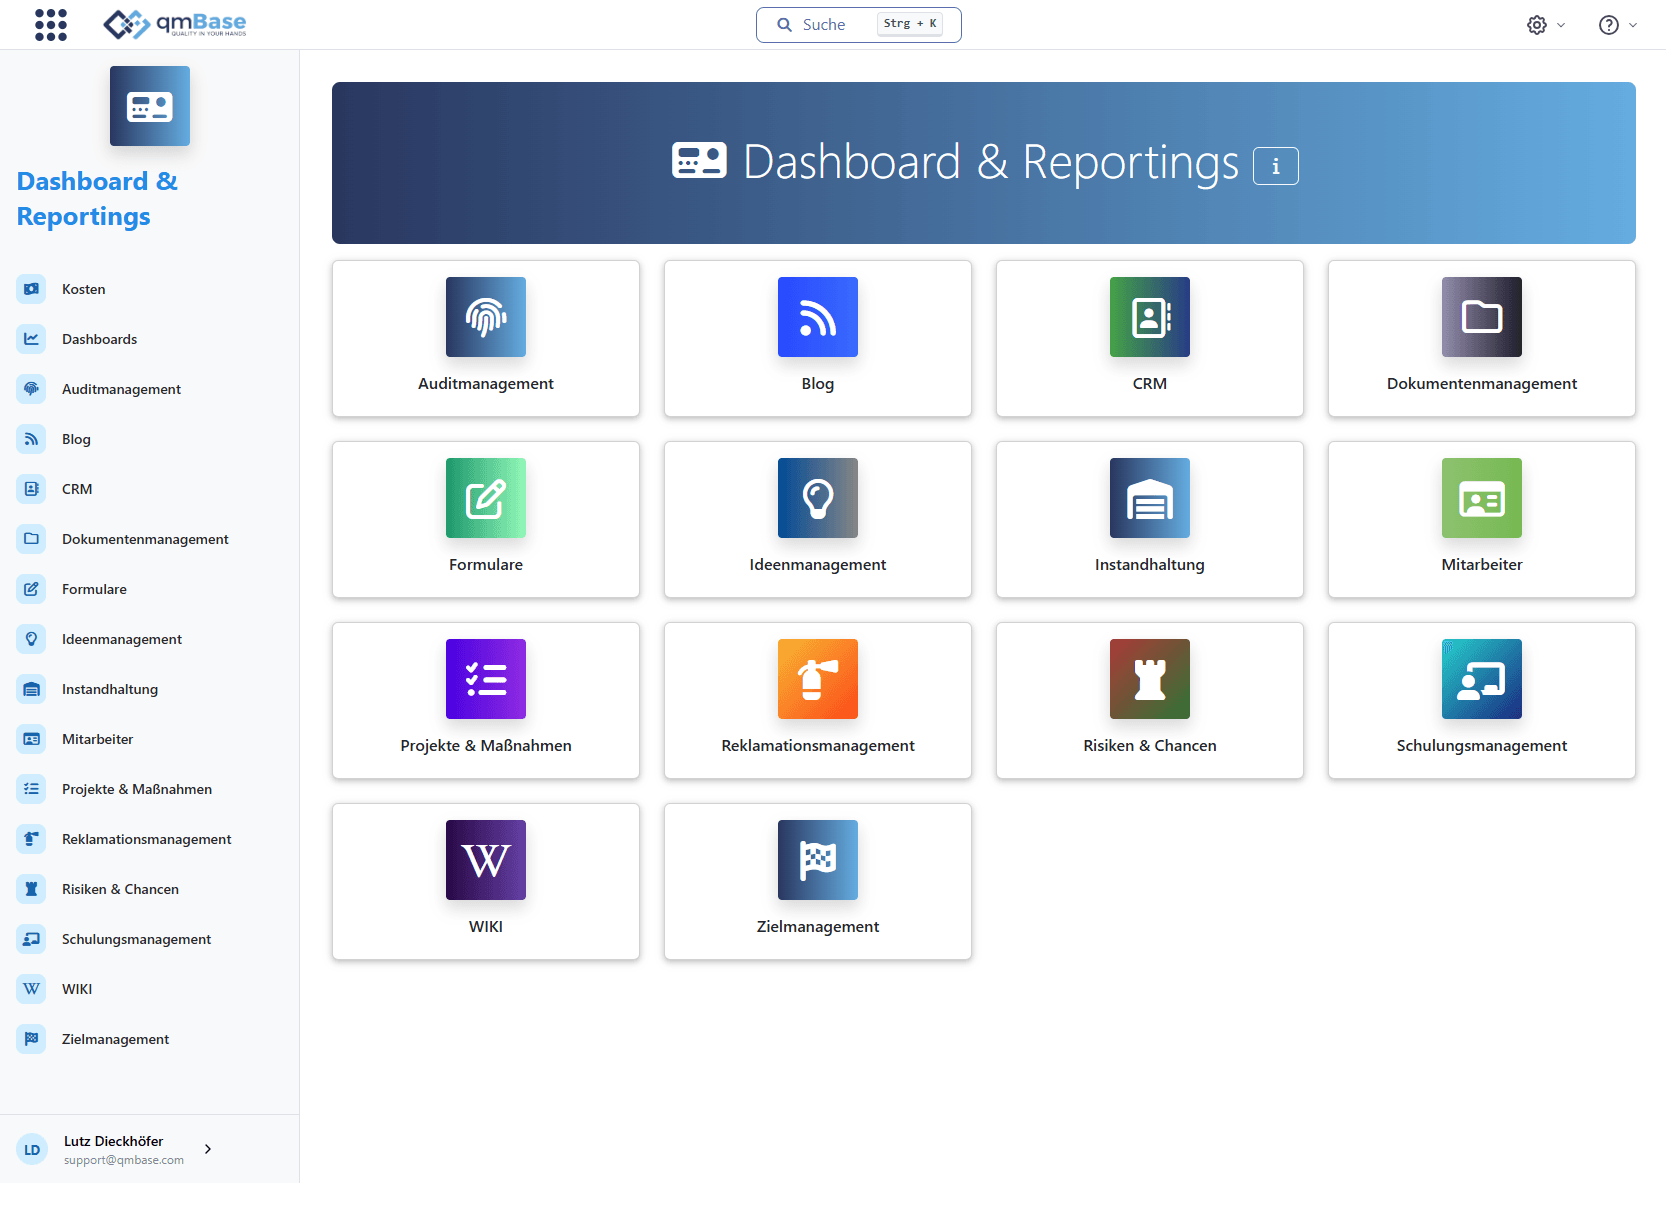
Dashboard & Reportings bundles the evaluations of your qmBase apps in one central place. With a few clicks, you get metrics, trends and analyses for exactly the area you want to inspect.
Actions
Keep open tasks and deadlines in view
Status, deadlines and responsibilities remain trackable.
Audits
Evaluate findings and audit status
Anomalies become visible beyond individual audit reports.
Risks
Recognize critical risks faster
Assessments and required actions are easier to classify.
Training
Identify qualification gaps early
Due dates and evidence remain visible for accountable teams.
Claims
Recognize recurring causes
Patterns can be analyzed across individual cases.
Objectives
Recognize objective deviations faster
Progress, status and deviations flow into decisions.
Cross-app evaluation
Dashboard & Reportings shows which topics need attention. This helps you recognize priorities, action needs and relationships faster.
Open deadlines, critical assessments, clusters and missed objectives become clear signals for accountable teams.
Evaluations from individual areas become visible in context, making priorities and required actions easier to recognize.
Dashboard
Metrics and action needs
Dashboard & Reportings shows where attention is needed: open deadlines, critical risks, recurring problems or missed objectives.
Attention required
42
open actions, 9 of them overdue
Action needed
7
risks above defined thresholds
Review topics identified
18
relevant topics for the management review
What the metrics make visible
Overdue tasks help prioritize follow-up.
42
open
Critical assessments help prioritize risks.
7
critical
Recurring findings show where improvement is needed.
12
Production
4 overdue
8
Purchasing
2 critical
6
Logistics
1 critical
5
Service
trend rising
Prepare management review
Management reviews need reliable information. Dashboard & Reportings helps prepare relevant developments, open items and metrics in a structured way.
Open items
Open actions and deadlines
Anomalies
Recurring problems and trends
Audits
Audit findings and evidence
Management review
Good decisions need reliable information. Dashboard & Reportings makes visible where action is needed.